|
Fort
Union’s fragile adobe walls have
consistently proven difficult to document given their irregular shapes,
complex surface topography, and layers of protective shelter
coats. Understanding the walls’ geometry
and massing, including attributes such as wall height, top profile,
transverse cross-sections, and planar attitude or plumbness could
provide crucial information about the current physical status of
individual walls, and help identify those walls most at risk
from
collapse. Building on past methodologies, a profilometry system was
devised, using a
relatively rapid, low tech, approach of recording, to select adobe
walls based on
cross-sectional profile analysis. This method, in combination with
other physical and environmental data, can provide important
information in the condition assessment of the ruins, allowing
comparative analyses that the NPS can use to develop risk typologies
for the standing walls.
|
The
documentation methodology presently used to
monitor the deterioration of the adobe walls at Fort Union, as outlined
by the current NPS maintenance plan, is twofold: digital photographic
recording, consisting of ‘before’ and ‘after’ photographs and
descriptive written notations to record areas of deterioration, a
history of past treatment
methods, and procedures for cyclical treatment. In recent
years, however, this monitoring practice has proven time consuming,
given the
number of walls to survey. Moreover, access to the tops of
high walls takes time and can be dangerous if the walls are leaning and
unstable. Nonetheless,
using photography and notes cannot begin to accurately
record the shape of these complex walls. Methods are limited in their
ability to show three-dimensional change.
Recording irregular eroded wall shapes accurately is a difficult feat
because the partially eroded walls:
1)
do not have straight surfaces
from which to consistently measure
2) are fragile and friable, so
any
method of measurement should minimize direct contact to avoid damaging
historic fabric
3) are too tall to easily compare
the two faces or
appreciate the approximate thickness from grade.
|
 |
| Team members comparing laser scanner data with the data taken using the profile comb. |
|
Because
Fort Union’s adobe walls were built on top of raised stone foundations
of similar width, comparison of the current adobe wall
thickness to
the stone foundations ensures a relatively accurate measure of surface
loss from
weathering (assuming later shelter coats are removed before
recording).
By
comparing longitudinal wall profiles, rather than transverse cross
sections, we are looking at the morphology of discrete wall elevations
removed from their context. This visual takes away
the context of the wall by only considering one side; however,
transverse
profiles help create wall types that can assist better in identifying
deformations, types and degrees of severity. Longitudinal elevations
provide a way of examining the walls that is different from transverse
cross
section which can be valuable when assessing different sides of a wall
and how they are responding to their respective microclimate. For
example, we can compare all of the wall faces based on orientation that
do not have an
adjacent wall to protect them. This comparison would indicate the
degree of variability of all of the walls that do not have protection
in the form of another wall. While the method does not allow us to
measure lean or loss of area, it can help us to examine the
micro-morphological differences in the patterns of deterioration that
affect the elevation. |
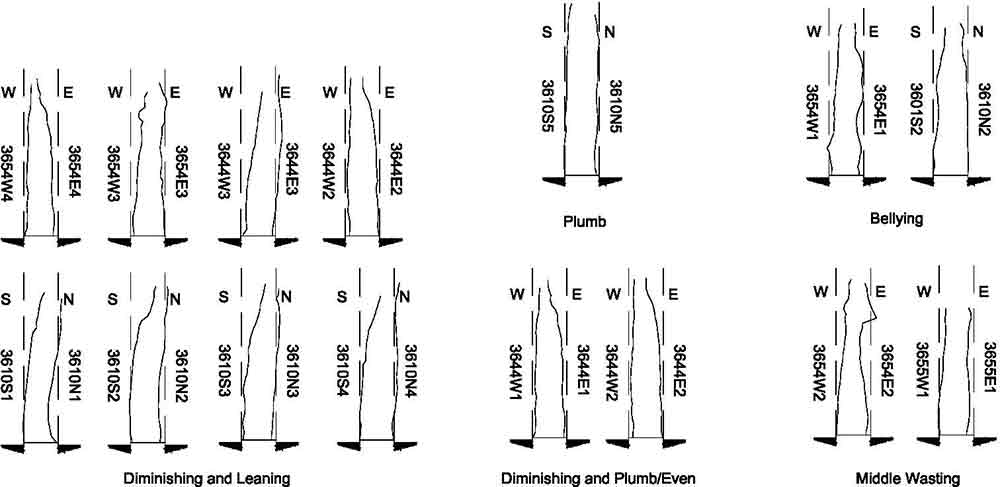
| The transverse cross
sections of the walls can illustrate
multiple factors that determine overall wall shape. If we consider
“plumb” walls to be those that are not experiencing uneven
deterioration, deformation, or lean, walls that are not plumb all have factors that
are contributing to their lean and/or loss of material. For walls that
are middle wasting, something is causing material to be lost at a
wall’s approximate midpoint. For bellying, material is lost in certain
areas while maintained in others, resulting in a curved line. We can
begin to attribute various factors that lead to the shapes seen in the
profiles and cross sections such as basal erosion and plastic
deformation. Basal erosion from capillary moisture occurs when water
or snow sits at the bottom or ledge of a wall. When this water is absorbed by
the adobe wall, it travels into the adobe by capillary suction and can
cause the clay binder in the adobes to dissociate and the area to lose
mass, solubilize and crystallize soluble salts, or freeze and thaw in
cold weather, also causing a reduction in basal mass and section. Wall
bases that remain damp for long periods of time are also prone to
deformation from reduced strength and can contribute to wall
lean.
With these illustrations, we can begin to analyze the morphological
data while experimenting with new ways to visualize and compare it in a
qualitative manner.
|
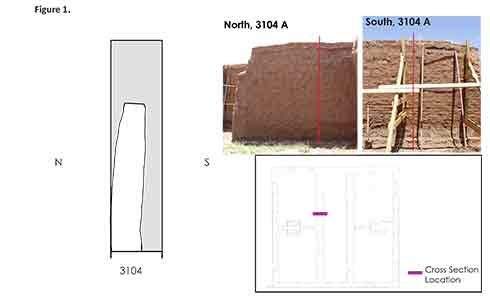 |
| A comparison of the measure profile of a wall against its known original shape and height. |
|
|
 |
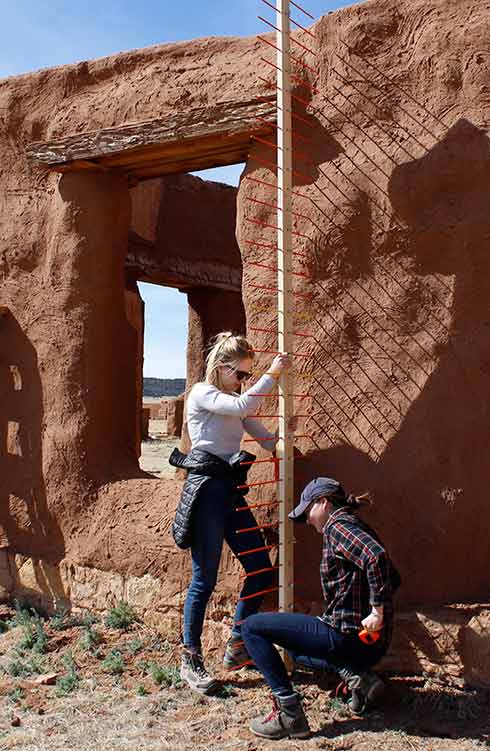 |
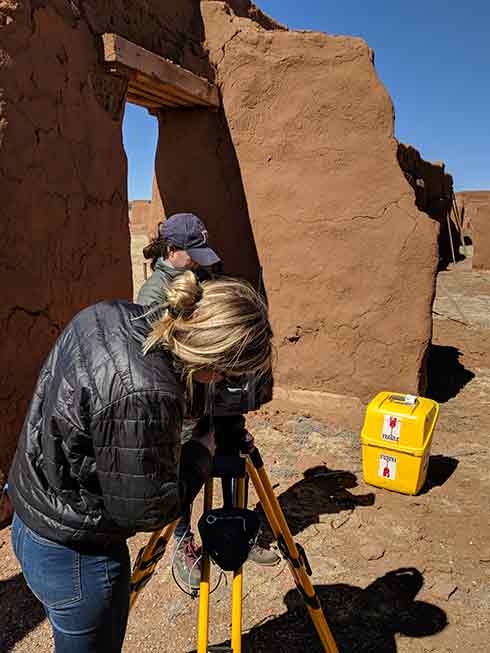
| Team members using a profile comb on a wall. |
|
More
advanced methods of recording, such as
photogrammetry and laser scanning, can provide a three dimensional
digital model of a wall’s surface, its mass, and an infinite number of
cross-sections, but have their limitations for small parks with limited
budgets. The results of the profilometry
method were compared to
photogrammetric
and laser scanning methods to critically compare the usefulness of each
method as well as the relative accuracy of this simple and cost
effective approach.
Photogrammetry and
laser scanning require
relatively high levels of technical expertise, especially for post
processing manipulation of data, and have high initial costs
for
hardware/software purchase and training unavailable to NPS and other
organizations responsible for cultural heritage management. Comparing
the
profile data with the the highly accurate laser scan
data showed that measurements taken with the profile gauge were well
within
acceptable tolerances
for the level of work being accomplished. The ability
to record an accurate cross-sectional profile of walls with a profile
gauge, developed by the CAC based on profile combs used in carpentry, proved to be a viable low-tech alternative
that can
accurately record overall geometry and mass shape of a wall as well as
plumbness (degree of out-of-plane). The only immediately apparent
limiting factor in this
method is the extreme locality of the profile for a given length of
wall; howver, for the needs of the project, this limitation does not
seem to be a significant issue. The rapid assessment form employed in
the first step of this assessment process is intended to limit the
number of walls which require a more intensive assessment where the
profile gauge would be employed.
|
|
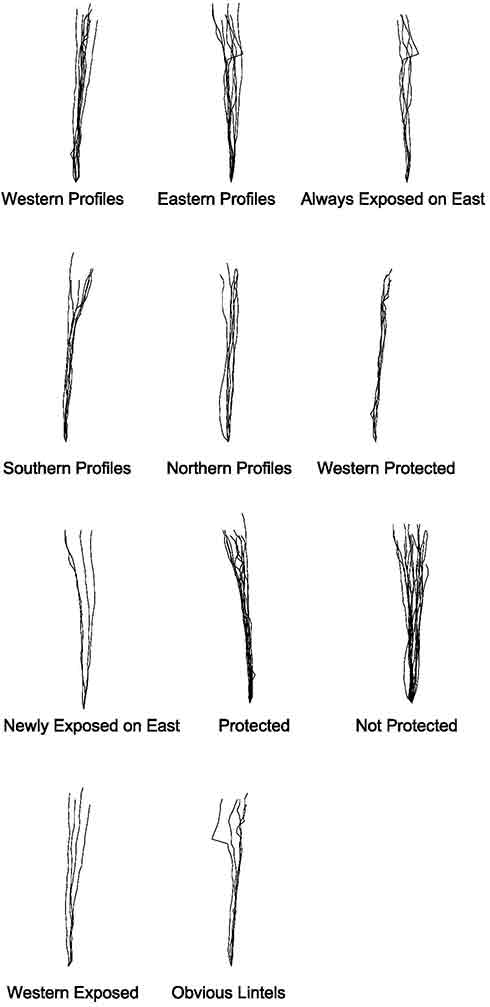 |
| Comparing profiles to each other by grouping based on potential contributing factors. |
|
| This
project contributes to the ongoing research by the University of
Pennsylvania’s Center for Architectural Conservation (CAC) to develop a
risk assessment plan and vulnerability index for ruined structures in
Vanishing Treasures parks. Building on work from 2017, which confirmed
the accuracy of the profile gauge as a documentation method to capture
the morphology of the ruined adobe walls at Fort Union. The profile
data recorded during fieldwork was processed using the same
methodology, but has several more walls, and wall ‘types.’ In the
second part of this project, we critically analyze the usefulness and
feasibility of the three methods for documenting and monitoring wall
conditions. The results can contribute to the future recording and
analysis of risk at FOUN. Although specifically crafted for measuring
the adobe walls at Fort Union, the profile gauge method could have
applications at other archeological or historic sites where traditional
methods of documentation are not suitable or high tech methods
unavailable. As conservators, we have a duty to determine the
usefulness of such technologies and for what projects they would serve
a direct and valuable purpose. This project hopes to provide
information that will inform Fort Union’s management and allow an
assessment of wall conditions and the vulnerability of the standing
adobe ruins now and in the future. |
|
| Sections presented below show the extent of
variation found in the walls of Fort Union. This variation can be
critical for understanding failure in both the immediate and long term
future. |
|
|