 |
|
 |
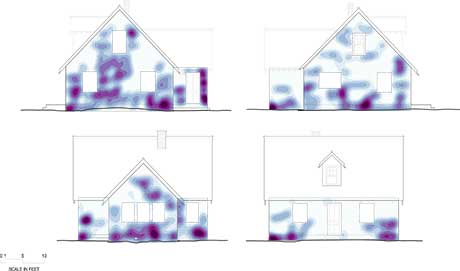
Densities
of large crack features were generated using spatial analysis tools in
ArcGIS. These graphics were compared to other images and models
produced in order to determine likely areas of detachment.
|
|
|
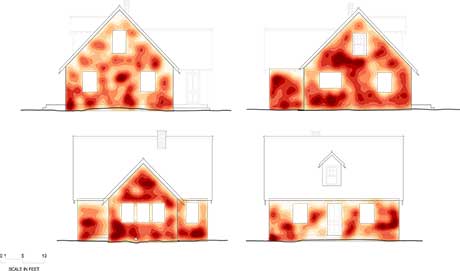
| Densities of all crack features were
generated
using spatial analysis tools in ArcGIS. These graphics were compared to
other images and models produced in order to determine likely areas of
detachment. |
|
|
|
| The
high integrity of the stucco limited the ability to conduct invasive
field investigation. While conditions like cracking,
discoloration, and paint loss are visible and can be easily recorded
using traditional means, other conditions such as blind detachment and
corrosion of the metal reinforcements would not have been possible to
thoroughly record without significant interventions. Due to good
condition of both the stucco and the interior finishes, for example, it
was not possible to probe or expose the underside of the stucco
in order to examine the condition of the metal attachments or detect
detachment from the underlying sheathing. |
| In
order to approximate these conditions, we experimented with a
methodology which compares results produced by three different
non-invasive approaches of assessment. Geographic information systems
(GIS), infrared thermography (IRT) image analysis, and photogrammetry
each have their strengths and limitations to indicate areas of unseen
damage. The graphics produced by each software can show the spatial
distribution of conditions, whether cracks, temperature, or
three-dimensional shape, but none of the results are absolute or can
independently indicate damage. An individual graphic by itself is often
not sufficient to corroborate the presence of a condition due to a
variety of limitations of that tool. Overlaying the resultant graphics
from each of the three systems together can help substantiate (or call
into question) areas of presumed deterioration by showing relationships between the results of the tests.
|
|
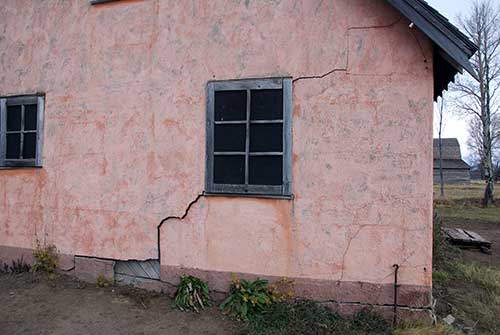 |
| | The south elevation displayed several cracks that were larger in size compared with cracks found on the other elevations. |
|
|
|
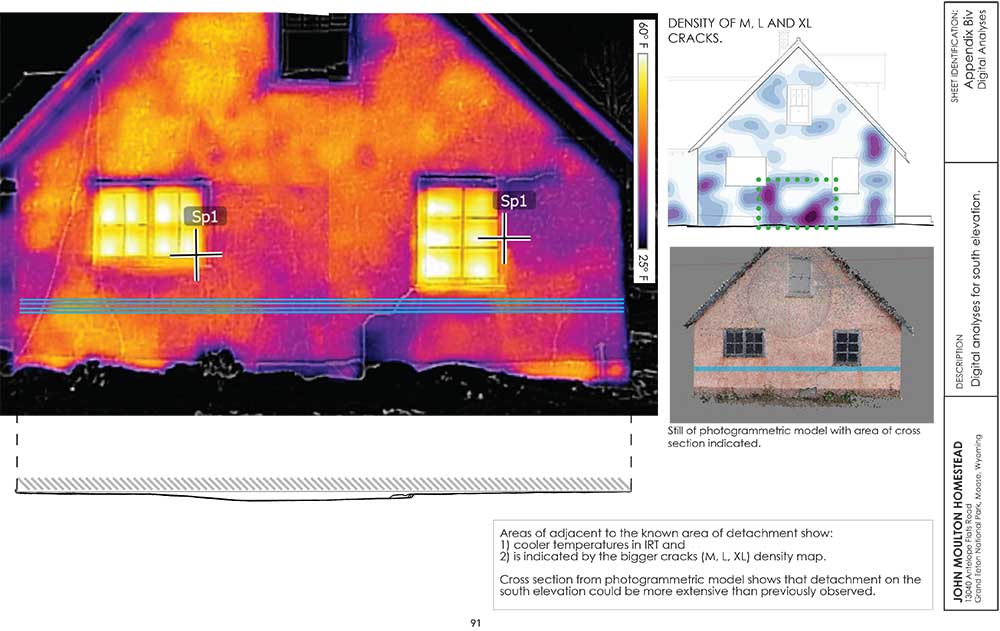 |
| Based
on a comparison of infrared imaging and the density graphics, areas of
the elevation were selected to test for delamination. Cross sections
were taken from a photogrammetric dense point cloud to look for
deflection of the stucco surface. |
|
| Ultimately, this
analysis did not indicate areas of
invisible detachment with certainty, but the results will guide
investigations in subsequent field visits. The process of graphics
overlay was the most successful for the south elevation, where the
analysis followed a series of suppositions, established using known
areas of deterioration and confirmed in the field. When comparing the
results of the north, west, and east elevations, which have no large cracks
that have displacement, graphical correlation using these three tools
was difficult to establish. The inconsistent results of the south
elevation, when compared to the other three elevations, may show that
the south side of the building is in fact an anomaly and that true
failure— failure which compromises the survival of the survival of the
stucco— is not reflected in the smaller cracks but instead is only
associated with the largest cracks which display shear displacement. |
|
In order to create these graphics the
following tools and softwares were used:
- ESRI ArcGIS
- FLIR C2 Compact Camera and FLIR Tools
- Agisoft Photoscan and
MeshLab.
|
|
|
|
 |