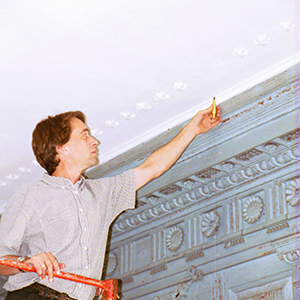
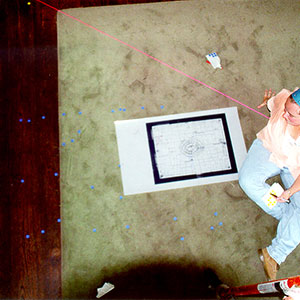
 | | Due
to the difficulty of measuring cracks on the ceiling, each crack
intersection point was mapped to the floor using a plumb bob. |
|  | | The
marks were then measured from two different established points on the
floor allowinf for easy triangulation into a digital file. |
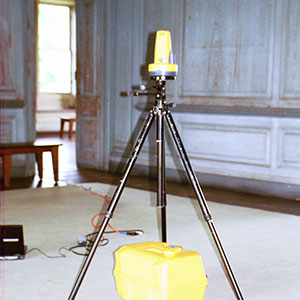
|  | | Included
with this process was measuring the vertical shift of the ceiling using
a laser level, whihc helped to identify the low points on the
surface. |
|
|
| The visible surface of the ceiling is only a small part of the entire
ceiling floor system.
It has been suggested that the variable sizes and
patterns of existing cracks may be external indicators of different
conditions of this entire ceiling/floor system, which include the
construction and movement patterns of the joists above, the location of
lathing fields, as well as the areas of delamination.
| | Cracking and
delamination may not always result from the same cause although crack
size may be directly related to the areas of delamination.
While these
cracks may indicate the location of problems with the ceiling/floor
system, they also function in a positive way providing control joints
which allow the non-flexible surface of plaster to bend with the moving
system, helping to reduce the appearance of additional cracks.
Unfortunately crack propagation is difficult to limit, and the
continued growth of existing cracks may be unavoidable. Under force, an
existing crack will continue to extend outward until it reaches a
limiting edge. Additionally, under a constant load an existing crack
will be more likely to continue to grow before new cracks appear. | | Concentrations of existing cracks are directly linked to the sizes of
the cracks.
Smaller cracks may be closer together, each taking up some
of the flex. Larger cracks may be taking the same amount of flex
requiring fewer cracks to distribute the force. Areas of the ceiling,
which have been compromised and repaired can directly impact the
direction of smaller cracking but do not seem to have an impact on the
larger cracks. Finally the patterns of the vertical deflection of these
cracks also show areas where the ceiling has deflected the greatest
under its own weight.
| | | | The
initial efforts involved collecting data. Old information existed and
was incorporated into the final set of maps. This early data consisted
of a 1991 survey which was conducted using a traditional acoustic
method of tapping on the surface of the plaster and listening to the
ring. While this approach is important it is highly subjective.
Additionally in this 1991 survey a map was created to identify the
location of the cracking patterns, which was incorporated onto a
rectified photograph of the ceiling. The final result, while good,
lacked accuracy. New data was collected using a plumb bob and two known
datum points. The intersection of each crack was identified and mapped
in AutoCAD using X, Y coordinates based on the measurements taken from
the datum points; additionally the Z coordinate was mapped from these
points using a laser level which created a level datum line around the
room. Once all of the data was collected and digitally drawn in
AutoCAD, each condition was then imported into Arcview. From this point
Arcview will be used to create regression modeling to identify the
correlation between the crack patterns and their variables. Spatial
analysis will be conducted using three extensions including Spatial
Analyst, 3-D Analyst and Geostatistical Analyst in order to find
the spatial structure of the cracks such as density as well as to create
predictive maps to identify potential threats and risk to the ceiling. | | | To
view the images below in full screen mode, and to read the complete captions,
click the small icon in the top right corner of the dark "viewer"
screen. |
|