The
ceiling of Drayton Hall is only 600 square feet, which is
relatively small for the application of GIS; however, by applying methods
used for large scale analysis, (locating roads, identifying geological faults),
similar patterns were identified on this much reduced scale.
The
use of GIS was an experimental aspect of this project that demonstrated encouraging results in its
potential use for both short term evaluation associated with treatment,
as well as longer term monitoring.
Once
all of the data were collected and digitally drawn in AutoCAD, each
condition
was then imported into Arcview. From this point Arcview was used to
create
regression modeling to identify the correlation between the existing
crack patterns and variables associated with them such as their
distance from each other. Spatial analysis was conducted using three
ArcGIS extensions
including Spatial Analyst, 3-D Analyst
and Geostatistical Analyst in order to find the spatial structure of
the cracks as well as to create predictive maps to identify the
location of
potential threats to the surface.
|  | 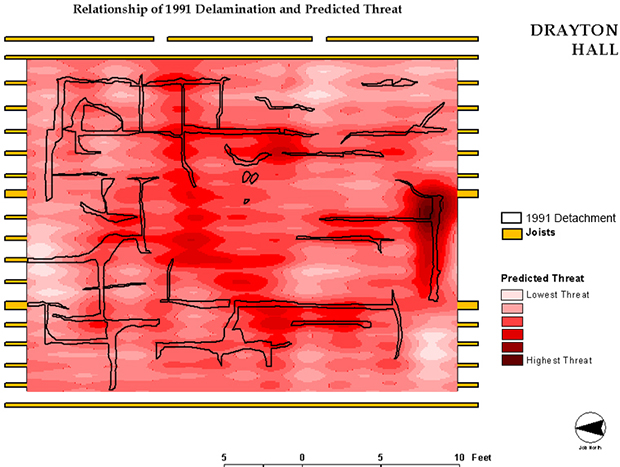 | | The
final map created was the result of a regression analysis. This process
statistically applied several different variables, each of which was
calculated by its defined weighting. The end result is a map that shows
potential unseen "threat" to the ceiling based on visible clues. |
|
|
|
|
In preparation for treatment, the 1991
documentation of conditions was extended to include size of cracking based on
width, direction of vertical displacement of cracking, and size of cracking
based on vertical displacement. Additional collected data included exact
locations of major ceiling features to assist in the creation of a CAD drawing,
to be used as a base map for all survey data, as well as treatment documentation.
Using triangulation from two datum points, measurements of over 600 ceiling
points were taken which included major decorative elements as well as the
intersection of all major crack intersections.
|
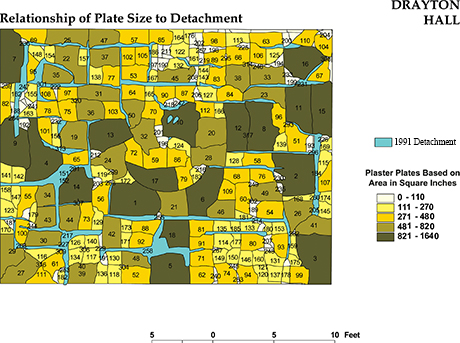 |
| While
the cracks were initially considered the most important aspect, the actual fields of unbroken plaster between the cracks
proved to be valuable as well. Note that most of the large areas of
detachment (blue) are in direct contact with the largest unbroken
fields of plaster (dark mustard and gray) . |
|
|
|
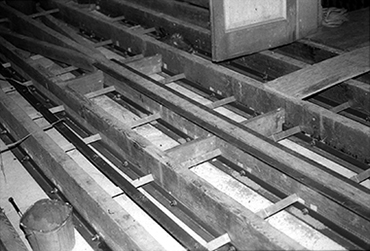 |
| Included
in the ceiling assessment was a review of previous treatments including
the pouring of plaster from above between floor joists in an
attempt to rebuild lost and broken keys. |
|
|
| The
2002 Geographic Information System (GIS) assessment provided the ACL with a
new way to study and identify the areas for potential
treatment based on proposed correlations between the cracks
and the
detachment,
allowing
us to approach
treatment more selectively and more intelligently. By looking at the more clearly defined areas
of potential threat from the 2002 GIS and by turning to the information
related
to the 1978 treatment, we were able to build confidence in the potential
results
of our selective injection method. The introduction of newer diagnostic
technology provided us with the evidence needed to treat fewer
areas with
greater confidence. |
|
|