| Fort
Union has a long legacy of weather
monitoring and recording, dating to 1851. By 1870 army surgeons had a
state-of-the-art weather station, with thermometers, hygrometer, wind
vane, anemometer, and rain gauge. |
|
|
|
Following
the wall collapse of the Summer of
2015, but prior to the first CAC site visit, the research
team
developed
preliminary environmental
simulations based on available data with the intent to
identify, categorize, and prioritize the complex environmental factors
contributing to the behavior of the adobe ruins. Spatial information
from the Historic
American Buildings Survey (HABS) drawings and
environmental data from the nearby Las Vegas Municipal Airport in Las
Vegas, NM were used in the simulations. This airport weather
station
is
located approximately 20 miles away from the park, but at the time was
the closest, most
complete and properly formatted weather data for use with the
simulations. The results of this series of simulations were
used
to propose a risk hierarchy based on environmental exposure for six
buildings at FOUN.
While
atmospheric conditions such as temperature, relative humidity, and
solar radiation exposure vary little at this distance, phenomena
including precipitation, wind speed, and wind direction may differ due
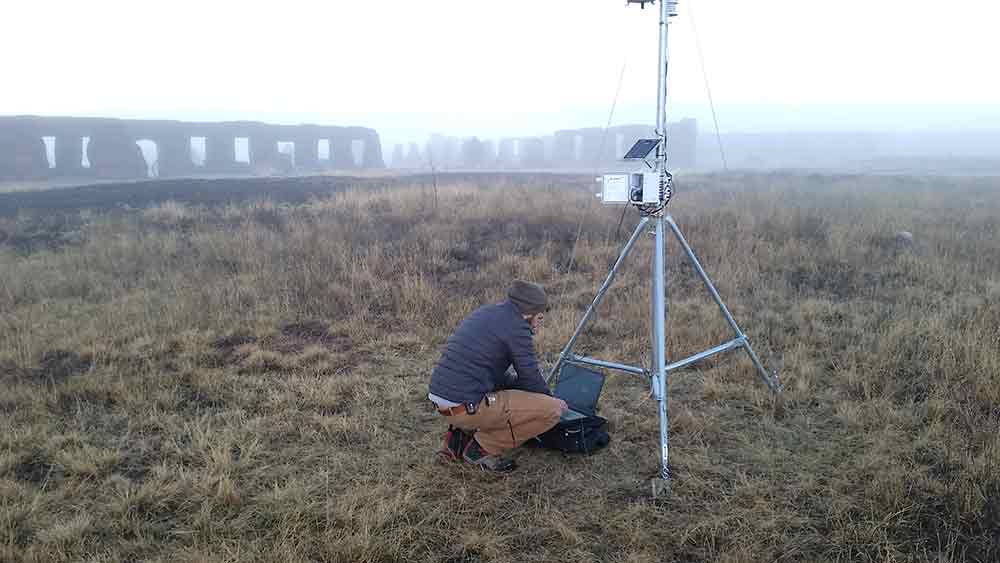
to the variation in local geography and boundary conditions. Following
the initial simulations, as part of
the first phase of site work, an Onset
weather station was installed approximately 30 meters to the
northeast of the Mechanics Corral to
provide a record of the micro-climatic variables affecting the park.
|
|
|
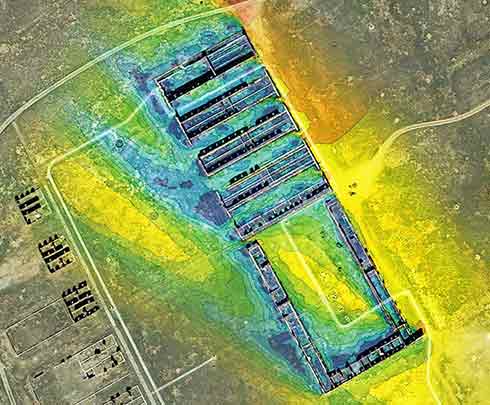
| Environmental simulations |
|
| To
complement the weather station data, the
research at the fort included a pilot study
to evaluate the various methods for measuring and monitoring
environmental conditions of the adobe walls in an attempt to identify
location for potential wall collapse. Embedded
monitoring and time-lapse photography were employed, similar to the
approach
implemented by Crosby
at Mission San José de Tumacácori
and elsewhere. Resistance moisture sensors were placed within and
around one wall located in the Mechanics Corral. This wall was selected
based on available data, preliminary simulation, and observable
conditions, to be the most environmentally exposed and therefore
represented a worst-case scenario for weather vulnerability. Ambient
temperature and relative humidity sensors were also installed within
the wall to determine the advantages of different sensor types. |
|
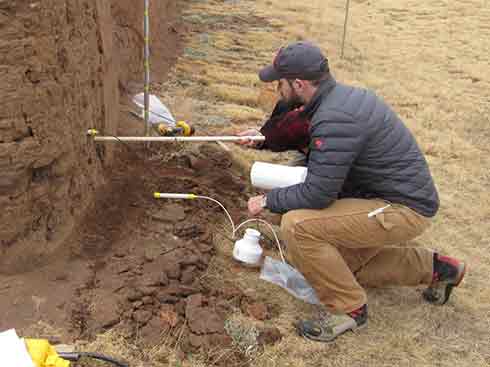 |
| Installation of
wall sensors required removal of the protective shelter coat which the
Park Service applies to the wall surfaces.Drilling holes into the adobe
were necessary to install the sensors which is inherently invasive. |
|
Self
evaluation of the work resulted in concerns for the embedded
method implemented, using conventional
means, which is inherently invasive and destructive. While feasible for
single installations, this approach is not practical when implemented
at the scale of the entire site, which is ultimately the goal.
The pilot monitoring program initially proposed drilling nine cores to
receive the sensors, instead of three, for the single test wall. The
cost of the equipment alone would have rendered the method impractical.
The second criticism of the monitoring program refers to the use of
ambient relative humidity sensors to measure moisture movement in an
adobe wall. It was difficult to ensure that the cores in which the
sensors were placed were effectively isolated from the exterior
environmental conditions. Furthermore, the data collected poses
additional limitations in its analysis. Relative humidity is,
by definition, affected by temperature, thus this measurement cannot be
isolated to provide an accurate reading of moisture content because of
this influence. The temperature of the adobe wall can affect the
temperature of the air within the core by convection and radiation. In
other words, the thermal inertia of the wall, or the lag in thermal
response to exterior conditions, influences the ambient hygric
conditions within the cores. Thus, the use of resistance moisture
sensors is recommended, which provide a direct, analog measurement of
moisture, rather than a proxy measurement. |
|
 |
|
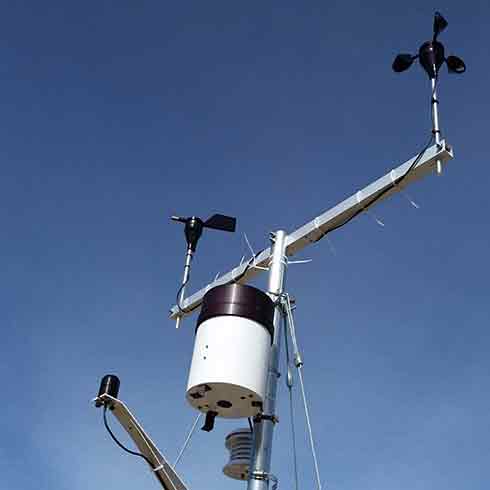
Since 2016, the ACL has
collected detailed, local weather information for the site using an
Onsite weather station with six individual sensors collecting the
following data.
- Temperature
- Relative Humidity
- Wind Direction
- Wind Speed
- Solar Gain
- Moisture
The initial assumption in 2015 was that climate (long-term
trend and
seasonal trends) and environmental exposure (specifically rapidly
fluctuating micro-climate) were the primary contributing factors to the
recent deterioration and vulnerability of the adobe ruins at FOUN. To
understand these factors, a state-of-the-art weather station was
installed adjacent to the Mechanics Corral. The excellent data
collected during the project suggests that the station remain
indefinitely. In establishing guidelines for identifying,
understanding, and addressing various risks at sites like Fort Union,
particularly those relating to or exacerbated by environmental exposure
and changing climate, this approach is critical.
|
|
 |
|
|
Weather
data from the onsite weather station can
be analyzed statistically to objectively present risk attributed to
certain factors. Exceedance probability (EP) curves have become one
popular method for risk evaluation. EP curves present the probability
that a risk event will be exceeded. As a low-cost alternative to
simulation and computational analysis, this statistical method can be
performed without additional software or expertise to quickly identify
the risk associated with a particular factor. For example, wind
speed and direction are unique, because they can affect instantaneous,
catastrophic failure of walls. Thus, wall segment orientation
is
immediately a significant contributing risk factor. With only the
onsite weather data, one could determine the probability that wind
speed exceeds a threshold value (perhaps determined by a structural
engineer) for each orientation, thereby prioritizing risk-prone wall
segments by orientation.
|
| Recent
research into the use of passive radio
frequency identification tags (RFID) for embedded moisture monitoring
can address these factors as a low-cost, passive, non-destructive
alternative. Passive technology, such as the RFID tags,
requires no power to operate. This eliminates embedding restrictions
that would be otherwise imposed by the need to power, offload data, and
troubleshoot equipment. An RFID reader is used to measure the change in
resonant frequency of the tag's antenna, which is caused by a
corresponding change in the moisture content of the surrounding medium.
Because the technology leverages the near-field of resonating
antenna, the tags do not need to be physically in contact with the wet
media, only near it. The limitation of the installed resistance
moisture sensors, that they must be in near perfect contact
with
the
adobe, is resolved. The tags also surmount the installation and
serviceability limitations of conventional methods, as they lend
themselves to being easily integrated with ongoing maintenance cycles
of the shelter coats and wall-caps. |
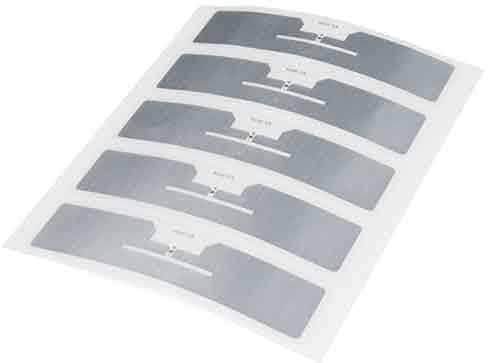 |
| Radio Frequency
Identification (RFID) tags are passive sensors which are embedded into
the adobe walls to allow internal moisture data to be collected. |
|
|
Traditional monitoring
methods, such as active embedded moisture monitoring currently
implemented, are inherently flawed when considering the underlying
question they are trying to resolve: can we predict risk using the
monitoring methods described? The dependent variable in this risk
'equation' is wall collapse. Even if the data sampling rate is high, it
is the occurrence frequency of dependent variable events that drives
the usefulness of the entire data set. In other words, if several test
walls are monitored for the necessary variables (e.g., temperature and
moisture,) at 15-minute intervals, and 10 years of data is collected
the data is not useful in predicting risk of collapse unless that
particular wall collapses. Using data collected from the embedded
sensors and the weather station at FOUN, a regression model
was
developed to predict the relative humidity (as a proxy for moisture
content) based on exterior environmental factors. The model can
accurately account for 98% of the observed conditions by correlating
wind speed and direction, exterior temperature and relative humidity,
and precipitation with interior relative humidity. Unless this wall
collapses, however, this data and the predictive model are no more
accurate at predicting risk than the EP curve method described earlier.
The particular regression model used, however, does provide the
relative contribution of each of the variables correlated, which can be
helpful in prioritizing the weight of various environmental exposure
factors. |
|
|