 |
|
The
original survey form developed in
1995 proved to be too complex, but was well intended. Its approach also
considered full sections of wall which proved to be to variable for
comparative assessment.
|
|
|
|
|
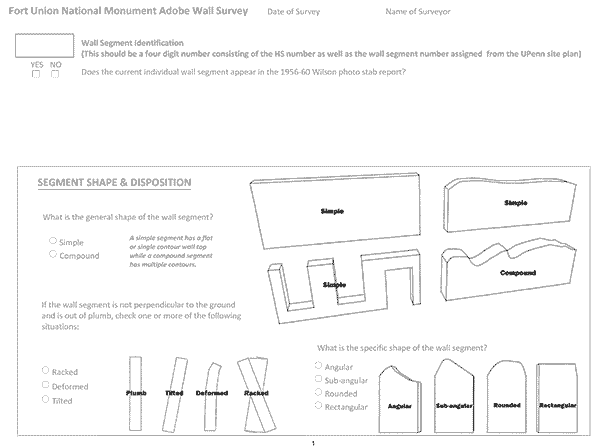
Our first attempt at a form
included graphics to assist in the assessment process. Following the
survey, it was determined that many of the questions did not address
the issues in a way that allowed the data to identify a scaled
assessment of all walls on the site.
|
|
|
 |
|
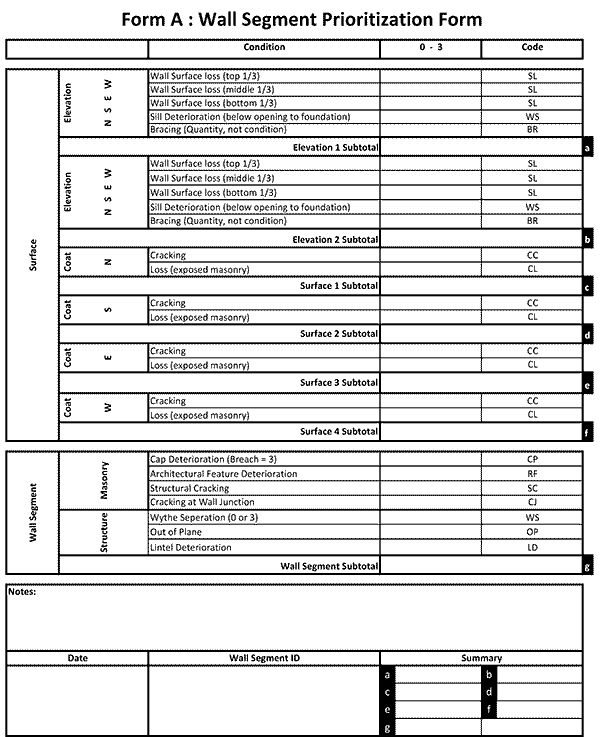
Above: Our
final form was the result of
extensive self evaluation of previous forms and the resulting data.
This form was meant to allow for "rapid" assessment that could then
rank all walls from best to worst condition, as well as provide a
way to evaluate each wall by its individual surfaces.
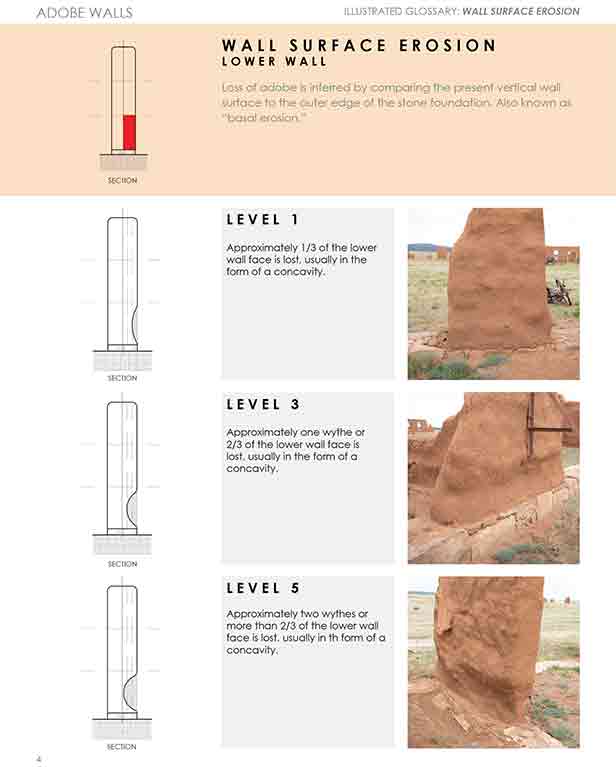
Below: A
representative page of the final conditions glossary created for the
survey.
|
|
|
|
|
|
 |
|
| Surveys
were completed for the adobe walls in 1995, 2016 and 2018. The
concept behind each survey was to identify erosion trends and to
prioritize stabilization so as to identify which walls needed treatment and
in which order. Following the
2016 survey it became apparent that the most problematic issue for
comparing data within a single survey, as well as comparing one survey
to another, was how the wall segments were defined. Different teams used
different ways of identifying a single segment. The question, which
proved most difficult to answer, was should each wall segment be defined
by room or building or should walls be divided up so that each
segment is comparative in size? Another issue was determining what
conditions were critical for assessing walls. |
|
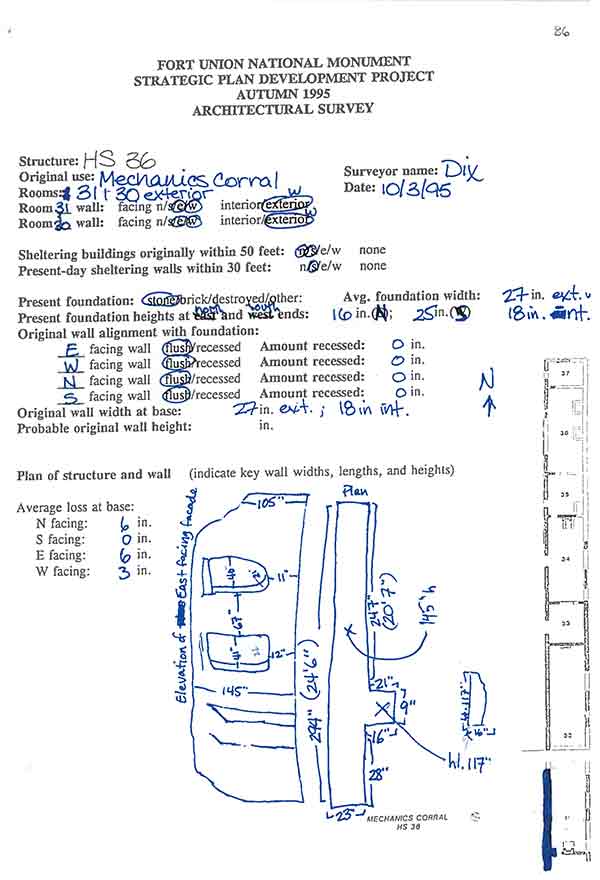
| The
original 1995 survey form consisted of two pages divided into eight
individual subsections. For this survey a wall unit was defined as any
number of wall sections in any orientation as long as they were all physically connected
to each other by adobe having no exposed foundation. Since any survey
of this type is fundamentally based on the concepts of databasing,
additional problems arose because there was no comprehensive code book
or glossary describing the rationale behind each question, making it
difficult to understand and analyse. In some cases how a question was asked was unclear and in
others, the responses would have provided better comparative results
if they had been recorded in a different format. Some data referred to
original construction, but without solid primary documentation to
substantiate this, the results were subjective. For example, the
question of “original wall width at base” would be very difficult to
know with any certainty unless measurable images were available. |
|
| It was determined that for the sake of future
assessment, the final survey needed to be usable by those without comprehensive conservation training. It was the
understanding of the CAC team from the beginning that the process of
creating an effective survey
might take several iterations. As with any effective system, the
questions needed to be tested for efficacy. In the initial attempt a
general condition survey was designed
based on historical documentation and known, as well as presumed,
condition data. The 1995 survey was critiqued to help inform the new design. As a rapid assessment survey, maximum
efficiency, consistency and repeatability were key considerations. The primary focus
was to categorize various observable “indicators” that were
contributing to past and active deterioration. These included initial
design features such as wall intersections, wall openings (image to the left), brick chimneys, corners,
and modern braces (installed
after NPS management of the site began in 1954), all of which provided points of fixity.
Contextual factors such as grade level,
soil bridging and exposure were included, as were present
attitude and context of the wall including: length,
width, height, lean, and shape. Although it was never the intent to
create a new survey for comparison to the 1995 data, it is unfortunate
that wall segments could not be defined in the same way as that
survey. For the sake of 2016 data comparison, a segment was defined as
a single continuous straight running length of wall. This resulted in more
segments than the 1995 survey. Aside from it being different in
approach, when evaluating the data it also proved to
be
inadequate for good comparative assessment.
|
|
| For the
2018 survey form, several issues were
resolved including the defined wall unit. Instead of working with
single continuous walls, each identified unit was divided to be comparative in
general size. A
continuous wall is considered a segment which is then broken into
"sectors".
Wall segments can be significantly different in length, however, wall
sectors are not. None of the sectors are identical in size, since the
divisions were
based on easily recognized physical features of the walls such as
window and door edges, but it was critical that they be similar in
massing
so that data could be comparative. In addition, the survey form
was streamlined so that all data could be recorded on one side of a
single 8.5 X 11 sheet of paper. This required the creation of a
comprehensive survey glossary of critical conditions which was fully reviewed and discussed by
the entire team before the actual recording process began. |
|
|
|
| Overall,
the survey was considered successful and
the Rapid Assessment Form effective by the NPS staff involved. The
Illustrated Glossary Document was
well-received and considered a powerful tool for identifification and
assessment of adobe wall deterioration typologies and phenomena. Based
on recommendations from the park staff, the glossary was reorganized to
match the order of the survey form itself, to aid in cross-referencing
between the two documents. Additional sections were added in the
Glossary Document to
further clarify the treatment of openings in wall sectors. For
instance, are exposed edges of openings considered as parts of the wall
sector or should they be considered separately? Additionally, the
treatment of wall conditions above lintels and below sills was
further clarified to avoid “double-counting” these areas in the overall
assessment of the sector. Addenda
included adding a key diagram illustrating the relative location
and significance of the four wall sector elevations as they relate to
the form.
|
|